Application Category Distribution
Below are a list of all of the top level categories and the number of applications currently active in each.
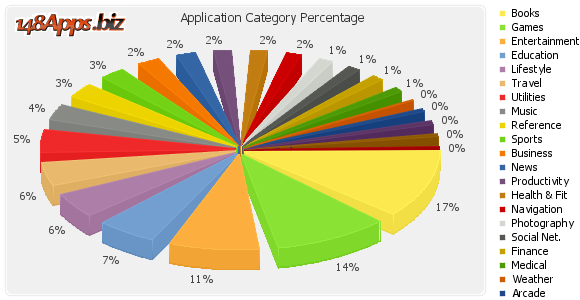
🔢Current Active Application Count By Category
| Category | Active Apps | % Share |
|---|---|---|
| Games | 14,671 | 17.23% |
| Books | 12,058 | 14.16% |
| Entertainment | 11,715 | 13.76% |
| Travel | 5,985 | 7.03% |
| Education | 5,834 | 6.85% |
| Utilities | 5,719 | 6.72% |
| Lifestyle | 4,433 | 5.21% |
| Music | 3,290 | 3.86% |
| Reference | 3,169 | 3.72% |
| Sports | 2,553 | 3.00% |
| Navigation | 2,373 | 2.79% |
| Productivity | 2,282 | 2.68% |
| Business | 1,930 | 2.27% |
| Healthcare & Fitness | 1,907 | 2.24% |
| News | 1,680 | 1.97% |
| Photography | 1,422 | 1.67% |
| Social Networking | 1,340 | 1.57% |
| Finance | 1,321 | 1.55% |
| Medical | 1,034 | 1.21% |
| Weather | 421 | 0.49% |
| Puzzle | 2 | 0.00% |
| Simulation | 1 | 0.00% |
| Arcade | 1 | 0.00% |
| Strategy | 1 | 0.00% |
| Total | 85,142 | 100% |