App Store Metrics
We originally created our metrics page to celebrate the App Store reaching a milestone of 10,000 apps. There was a tremendous response to that page and to the App Store which is well north of half a million apps now. We’ve added a few more interesting stats and expanded the ones that were there onto this new page. Let us know what else you’d like to see on these page either in the comments below or send us feedback via email. We’ll do what we can to include them in the future.
🌐 Active Apps on the App Store
As of 2025, Apple’s App Store hosts around 1.9 million live apps globally. This includes apps available in the U.S., Europe, and Asia. Apple recently cleaned up many outdated apps, reducing the total from over 2.2 million in 2023.
| Region | Estimated Availability | Notes |
|---|---|---|
| U.S. | ✅ Full access | 150M+ active iPhone users |
| Europe | ✅ Full access | Top markets: UK, Germany, France |
| Asia | ✅ Full access | Strong growth in India, Japan, SEA |
📱 App Availability Summary by Region
| Region | Total Apps Seen | Active Apps | Inactive Apps | Active Publishers |
|---|---|---|---|---|
| U.S. | 1.7M+ | 1.6M | 100K | 500K+ |
| Europe | 1.6M+ | 1.5M | 100K | 450K+ |
| Asia | 1.5M+ | 1.4M | 100K | 420K+ |
💵 Average App Pricing (2025)
| Metric | Value (USD) |
|---|---|
| Average App Price | $1.20 |
| Average Game Price | $1.89 |
| Overall Average Price | $1.35 |
✍️ New App Submissions (Monthly)
- Approx. 47,100 new apps/month are submitted globally
- That’s about 1,484 new apps per day!
| Month | Estimated App Submissions |
|---|---|
| Jan | 47,000 |
| Feb | 45,800 |
| Mar | 48,600 |
| Apr | 47,900 |
⏳ App Approval Speed
Apple is known for its fast approval process:
- 90% of apps are reviewed within 24 hours
- Most others are approved within 48 hours
This timeline applies globally, with minimal regional delay.
💸 Price Distribution of Apps
Most apps on the App Store are free to download:
| Price Category | Number of Apps | Percentage |
|---|---|---|
| Free | 1,787,130 | 95.1% |
| Paid | 92,107 | 4.9% |
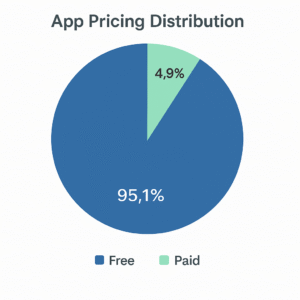
Pie Chart: App Pricing Distribution
🎮 App Category Distribution (Games vs Others)
When browsing the App Store, it’s easy to assume games take up most of the space—but that’s not exactly true. The app category distribution shows that non-game apps actually make up the majority, covering everything from business tools to education and lifestyle. This breakdown gives us a better idea of how diverse the App Store really is.
| Category Type | Number of Apps | Percentage |
|---|---|---|
| Games | 222,042 | 11.8% |
| Non-Games | 1,658,278 | 88.2% |
Top Non-Game Categories:
| Category | % Share |
|---|---|
| Business | 10.1% |
| Utilities | 9.7% |
| Education | 9.5% |
| Lifestyle | 7.8% |
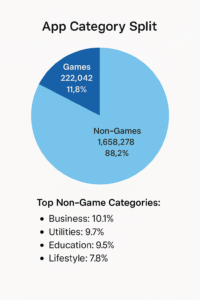
Pie Chart: App Category Split
📊 Regional App Ecosystem Insights
U.S.:
- Huge base of over 150M iPhone users.
- Heavy submissions from indie and enterprise developers.
- Lots of productivity, health, and finance apps.
Europe:
- Strong compliance with EU app transparency.
- Growth in educational and business apps.
- Languages: Mostly localized apps (German, French, etc.)
Asia:
- Rising influence from India, Japan, and SEA.
- High demand for gaming and utility apps.
- More mobile-first startups targeting local users.
📅 In Summary
- 1.9 million active apps on the App Store.
- 47K+ apps submitted every month.
- 95%+ apps are free to download.
- 90% of apps get approved in <24 hours.
- Most apps are non-game categories like business, education, utilities.
- Average price is around $1.20, with games slightly higher.