Count of Active Applications in the App Store
This page shows the number of active applications in currently in the US App Store. Active applications, for the purpose of these metrics, are applications that appeared in the app store on a particular day/week/month ,according to the latest 2025 data.
Apple’s U.S. App Store continues to evolve, with developers submitting new apps every day while older or non-compliant ones are removed. Here’s a quick snapshot of the current landscape:
📊 App Availability Status
| Metric | Value |
|---|---|
| Total Active Apps (currently downloadable) | 37,956 |
| Total Inactive Apps (removed or no longer live) | 4,577 |
| Total Apps Seen in U.S. App Store | 42,533 |
| Active Publishers (developers with live apps) | 11,510 |
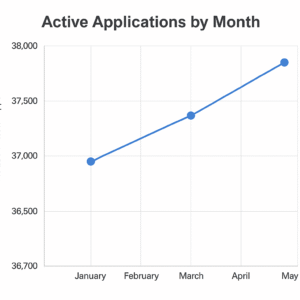
📅 Active Applications by Month (Rolling Trend)
Here’s a quick look at the app activity trend by month in 2025 so far:
| Month | Count of Active Apps |
|---|---|
| January | 36,780 |
| February | 37,100 |
| March | 37,500 |
| April | 37,750 |
| May | 37,956 (latest) |
You can see steady growth, indicating strong app submission rates and maintenance by publishers.